Are All Hazards Created Equal?
.jpg)
OSHA regulations speak in absolutes: there is a hazard or there isn’t a hazard. In reality, though, there are varying degrees of hazards because there are varying degrees of severity and varying degrees of likelihood that an incident will occur. You will see this reflected by OSHA in their citations (De Minimis, Other than Serious, Serious, Repeat, Willful), but the regulations are written to protect against the very existence of a hazard, regardless of its likelihood or the severity of injury that could occur due to lack of compliance.
In order to determine what hazards you have and the means by which you will protect your workers, it is important to do an assessment. Let’s take fall protection situations for example. You could have multiple fall exposures in your facility, but budget, scheduling of contractors, etc. do not allow for you to immediately abate each and every one. Just determining that there is a hazard does not help you decide which hazards to focus your efforts on. However, if you assess your hazards based on frequency and severity, you start to get a better picture.
If you’re still confused, picture this scenario. You have two locations that have an exposed drop of 20 feet. One is the top of a ladder that is used all day, every day. The other is the edge of a mezzanine that is only accessed by maintenance personnel when a repair is needed. Both are indeed fall hazards. The severity of a fall from either of them is pretty much equal. The main difference here is how often your workers are exposed to the danger. With the ladder, it is multiple times daily while with the mezzanine it is infrequent at best. This points to the fact that your first priority should be to install a ladder gate near the top of the ladder. You can then, at a later date, worry about protecting the edges of the mezzanine. In the meantime, you can restrict access to the area and require any maintenance personnel needing to go on the mezzanine to utilize personal fall arrest systems.
So, what’s an easy way to do this? The following chart is a good tool to help you determine which hazards are the most in need of attention:
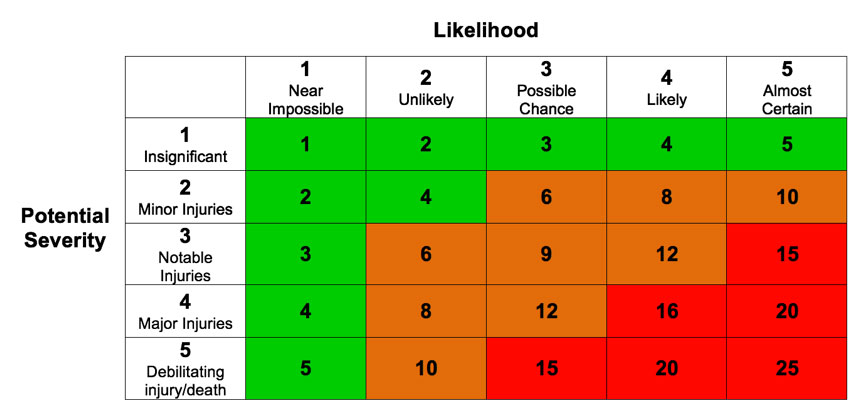
As you can see, these may not be precisely measurable criteria, so you’ll need to estimate your responses or, better yet, come up with your own benchmarks for each category to help you better determine the severity of the hazard or frequency of your employees’ exposure. For instance, the frequency with which your employees expose themselves to a hazard is directly proportional the certainty of injury – the more frequent the exposure, the more likely you are to have an incident occur. Therefore, you could, if you wanted, change the categories along the top to Frequency of Exposure. Then you could list them as Rarely, Annually, Monthly, Weekly, Daily (or you could just know in your head that those were the equivalent categories).
Sometimes, what we see at first glance isn’t accurate. Something can look like much more of a hazard than it is, while other things that don’t look hazardous can pose a big danger to your employees. This tool keeps you from having to guess. Without it, should something go wrong and you get asked the question, “Well, how did you assess the hazard?” or “Did you even assess the hazard?” you would have nothing to point to. This chart makes your hazards measurable, which means you are making better decisions. Better decisions mean your employees are better protected. Isn’t that our end goal?
